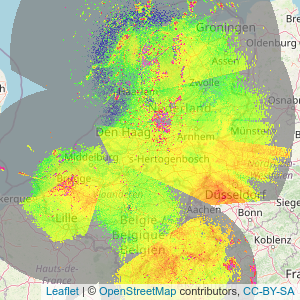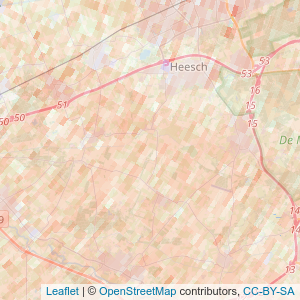
The goal of starsTiles is to provide a simple way to add large data sets in R to a leaflet application. Examples are available on the website. Because it is possible to provide functions pretty much any data that can be projected can be visualized, for example composites or non square grids. This is en example of using data from meteorological radar:


You can install the development version as follows:
This is a basic example which shows you how to solve a common problem:
Some example data can be downloaded as follows
require(ecmwfr)
request <-
  list(
    "dataset_short_name"  = "reanalysis-era5-pressure-levels",
    "product_type"  = "reanalysis",
    "variable"       = c("temperature", "geopotential", "u_component_of_wind", "v_component_of_wind"),
    "pressure_level" = c("875", "900", "925"),
    "year"           = "2000",
    "month"          = "04",
    "day"            = as.character(27:29),
    "time"           = sprintf("%02i:00", 0:23),
    "area"           = "64/-130/-64/144",
    "format"         = "netcdf",
    "target"         = "test.nc"
  )
# make sure you use your own uid and key ( https://cds.climate.copernicus.eu/#!/home )
wf_set_key("uid", "key", service = "cds")
ncfile <- wf_request(
  user = "uid",
  request = request,
  transfer = TRUE,
  path = "~",
  verbose = FALSE
)The following commands would start a tile server
# note the process is ran in the background, do not forget to close it as it might use quite a bit of memory.
require(callr)
#> Loading required package: callr
rp <- r_bg(function() {
  # read a stars grid
  weatherData <- stars::read_stars("~/weatherData.nc", proxy = FALSE, sub = "t")
  names(weatherData) <- "t"
  sf::st_crs(weatherData) <- "+proj=longlat"
  colorFunction <- leaflet::colorNumeric("viridis", c(250, 310))
  colorFunctionWithAlpa <- function(x, alpha = 1) {
    paste0(colorFunction(x), as.character(as.raw(
      as.numeric(alpha) * 255
    )))
  }
  starsTileServer::starsTileServer$new(weatherData, colorFun = colorFunctionWithAlpa)$run(port = 3746)
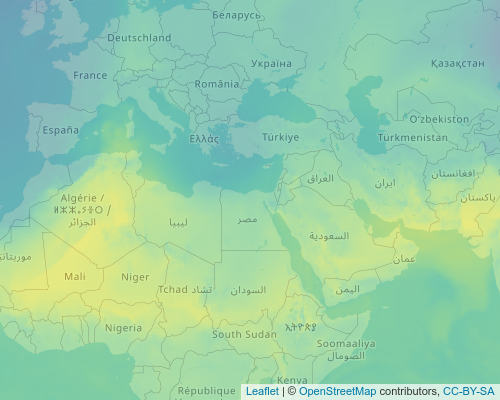
})In a separate R session the data can be added to a leaflet map (in this case temperature from the 900 mb level, at 2000-04-27 01:00:00)
require(leaflet)
#> Loading required package: leaflet
require(leaflet.extras)
#> Loading required package: leaflet.extras
map <- leaflet() %>%
  addTiles() %>%
  enableTileCaching() %>%
  addTiles(
    "http://127.0.0.1:3746/map/t/{z}/{x}/{y}?level=900&time=2000-04-27 01:00:00&alpha=0.5",
    options = tileOptions(useCache = TRUE, crossOrigin = TRUE)
  ) %>%
  setView(zoom = 3, lat = 30, lng = 30)
This map looks as follows:

The documentation of the api is available by appending url with __docs__ in this case: http://127.0.0.1:3746/__docs__/.
We have to make sure we close the server that is running as a separate process:
message(rp$read_output())
#> t,
message(rp$read_error())
#> Running plumber API at http://127.0.0.1:3746
#> Running swagger Docs at http://127.0.0.1:3746/__docs__/
rp$finalize()Several other solutions do exist for visualizing gridded data on leaflet maps, for example leafem::addStarsImage, these do however differ in two distinct ways. First they render static grids, therefore visualizing times series of data or dynamically switching to a different layer/dataset might be quite challenging. Second the starsTileServer makes zooming in the map possible. For each zoom level the map is dynamically rendered meaning it is possible to zoom in and out without loosing any information.
Another package that can be used for visualizing gridded data in leaflet is tiler. This package renders a static set of tiles. The advantage is that no server needs to be running to use these tiles. However the disadvantage is that all rendering needs to be done beforehand. For large datasets this can require considerable resources both for storage and calculation.
Dynamic rendering opens also possibilities to visualize other data dynamically. The package allows for custom functions that render tiles. These can be used to visualize derived attributes (e.g. wind speed or uplift), data from other data sources (like databases) or non-regular data (e.g. radar images).
Another big difference is that the data storage and the computer where it is visualized do not have to be the same for a tile server. One tile server can be used by many users. It is also possible to scale the rendering resources by making the rendering process parallel.
tiles?Tiles are the small images used by online maps to visualize the maps. These are generally 256*256 pixels and generated on various zoom level. More info can be found on wikipedia.